


![Movie poster for '[Rec]" (2007).](https://www.lionnewspaper.com/wp-content/uploads/2023/04/rec-640x900.jpg)


2021 Illinois State Report Card shows downward trends
LT sees decrease in overall SAT performance, achievement gap lessens
February 8, 2022
The Illinois State Report Card for LT was released on Dec. 2. It included data from the spring 2021 SAT standardized testing cycle, along with other data regarding various school demographics, such as teachers, academic progress and student body population. Each Illinois public school receives an updated report card annually. However, there was no testing data released for the 2020 spring testing cycle due to the COVID-19 pandemic.
The traditional SAT has consisted of two mandatory sections (ELA and Mathematics) and an optional essay section. While previously mandatory for most college and university admissions, in recent years, due to the COVID-19 pandemic, many schools have opted to make the test optional for current admission cycles.
Whether this test is an accurate assessment of students has been questioned by some. Critics have said that the test leans in the favor of certain demographics over others, due to resource and opportunity exposure, according to the North by Northwestern website.
SAT changes format
The College Board announced on Jan. 25 that the SAT test would be completely online internationally in 2023 and online in the United States in 2024. The overall test will be shortened to allow more time for each question and calculators will be allowed for the entirety of the SAT Math section. The testing window will shift from three hours to two hours, and students will be allowed to test on personal devices. With these changes, the College Board is attempting to address student and educator concerns related to testing.
Achievement gap at LT
For many years, LT has had a notable achievement gap (also known as the opportunity gap) between minority (Black, Hispanic) students and white students, as well as low-income versus non low-income students, when looking at standardized testing performance. The standardized testing achievement gap at LT has been notably larger than the state’s average since 2017, when the data for this topic was first uploaded to the Illinois State Report Card website.
For the 2021 testing cycle, the gap at LT seemed to lessen from previous years. This was not due to better performance on the SAT by Black and Hispanic students, but rather, the white student demographic having the largest decrease in performance in both the ELA and Mathematics categories of the SAT.
“There was a decrease in the SAT mean total and a decrease in the ELA and Math mean total for the Class of 2022 compared to the Classes of 2018, 2019, 2020, and 202,” Coordinator of Assessment and Research Katherine Smith said. Decreases were experienced by all population groups. There are many possible reasons for this decrease. ”
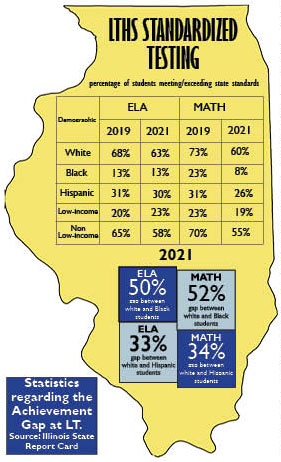
There was no Illinois state average from 2021 reported to compare to the 2021 LT data. 2019 was the last year reported where a state average was given. In 2019, the gap between Hispanic and white students at LT in the SAT Mathematics section was 42%, with 73% of white students meeting or exceeding expectations and 31% of Hispanic students meeting or exceeding expectations. The state average for that year was only a 24% gap between those demographics. In the most recent report, the gap at LT decreased to 34%, with 60% of white students meeting or exceeding expectations and 26% of Hispanic students meeting or exceeding expectations in the math portion of the SAT.
In the ELA section of the SAT, there was a 37% gap in 2019, with 68% of white students meeting or exceeding expectations and 31% of Hispanic students reaching that standard at LT. The state average for that year was a 25% performance difference between the two demographics. In 2021, the gap lessened to 33%, with 63% of white students and 30% of LT’s Hispanic students meeting the standard.
In 2019, there was a 50% gap in performance between Black and white students at LT in the SAT Mathematics section. 73% of the white student demographic met or exceeded expectations, while 23% of Black students were meeting expectations, with no percentage exceeding expectations. In 2021, overall performance in this category dropped for both demographics, and the gap in this section increased to a 52% difference; 60% of white students met or exceeded expectations and 8% of Black students met expectations.
There was a 55% difference between white and Black students at LT’s scores for the ELA section in the 2019 data. 68% of white students and 13% of black students met the standard of either meeting or exceeding expectations. In 2021, the gap dropped to 50%, with 63% of white students and 13% of Black students reaching the quota for meeting/exceeding expectations. The gap did close 5% from 2019 to 2021, but this is due to the fact that white students had lower performance than in 2019.
The low income versus non-low-income students at LT had a 47% gap in performance in 2019, while the state’s average was 31%. 70% of non-low-income students were meeting or exceeding expectations in the SAT Mathematics section, while 23% of low-income students were meeting expectations. The gap had a significant drop in 2021, with a 36% gap; 55% of non-low-income students were meeting and exceeding expectations, while 19% of low-income students were meeting or exceeding expectations. There is a very evident change from 2019’s data to 2021’s data, but that can again be attributed to lower performance within the white student demographic.
In 2019, there was a 45% difference between non-low-income versus low-income students at LT in the SAT ELA portion, while the state average was 31%. In the most recent data, this gap lessened to 35%, with 58% of non-low-income students and 23% of low-income students meeting criteria for either meeting or exceeding expectations in the ELA section of the SAT.
It is important to note that overall, most demographics at LT are performing above the state averages in their respective demographics, according to the Illinois State Report Card. However, the achievement gap within LT is larger than the state average achievement gap because white students outperform the state average at a greater level.
Reasons for the drop in scores
“Many students in the Class of 2022 took the last quarter of geometry asynchronously and Algebra II in a hybrid environment,” Smith said. “It is possible this impacted test scores.”
LT’s class of 2022 spent their junior year in a hybrid format with 525 less instruction minutes per week than a normal school year, Smith said. This is one of two reasons that probably contributed to the decrease seen in the SAT Mathematics section.
College Board SAT Assessment
LT also receives SAT performance reports from the College Board (the Annual Standardized Assessment Report), Smith said. The administration tends to feel that the College Board reports are a more accurate measure of student performance. Access to the College Board report is public and can be found on the LT website under the Office of Assessment and Research, in the Student Resources section.
It is important to note that the College Board and the Illinois State Report Card have different benchmarks for meeting/exceeding expectations, according to the Annual Standardized Assessment Report: October 2021. The College Board has 480 as their benchmark number in the ELA section, while the Illinois State Report Card uses the score of 540 as their benchmark. In the Mathematics section, the College Board’s benchmark score is 530, while the Illinois State Report Card holds their standard at 540.
The College Board evaluates student performance in three categories (Strengthening, Approaching, and Meeting), while the Illinois State Report Card assesses students in four categories (Level 1, Level 2, Level 3, and Level 4). Due to these disparities in score reporting, the College Board lists fewer students as not meeting/exceeding expectations than compared to the Illinois State Report Card.
Preparation for success on the SAT
LT is offering winter SAT preparation classes for the class of 2023, SAT Prep teacher Amy Johnson said. Many teachers are also trying to implement SAT-like questions and prep for current juniors into their daily classes. The test prep class is free for students who qualify for a fee-waiver.
The goal of the administration is to work towards closing the achievement gap between demographics within these standardized tests, Smith said.
“Because the SAT is paid [for] by the state for every student, it does give every student an equal shot at taking the test,” Johnson said. “We can probably do more equitable things in terms of access to the SAT. There is more we can be doing for students who might not be able to afford multiple sittings of the test. We could try to have them take an earlier test and then have them go through the SAT Prep class to prepare [for a second SAT test].”